Please try the new Global version of the AIM Report!


Frequently Asked Questions
We hope you'll find answers to your LBT questions here! Please also check out the extensive tooltips spread throughout this site (for helpful info, just hover your mouse pointer over any "i" in a circle). If you're just getting started, read the LBT Quick Start Guide and/or the LBT Embodied Carbon Quick Start Guide to review the first data fields you'll need to fill.
For information and FAQs on the AIM Report, please visit the AIM Report Help Center.
FAQ Topics
- Why Benchmark Lab Buildings?
- Entering Data on Your Buildings
- ENERGY STAR Portfolio Manager Connection
- Benchmarking Results
- Non-U.S. Locations and Metric Units
- Labs2Zero Pilot Energy Score
- Labs2Zero Pilot Operational Emissions Score
- Labs2Zero Embodied Carbon Benchmarking
- Data Sources and Contents of the Peer Group
- Operational Practices Benchmarking
- Previous Versions and Improving the LBT
The Questions
Why Benchmark Lab Buildings?
Why should I benchmark my lab building(s)?
Can the LBT be used for LEED O&M?
Entering Data on Your Buildings
How do I enter my building’s data?
What information should I have available before I start to enter a new building?
What if I don't have all of the requested information?
What if I have fiscal year energy use data, not calendar year data?
How do I account for my district energy supply?
Can I input data over multiple sessions or do I need to enter everything at once?
How can data entry be split between several individuals at my organization?
What is the difference between net and gross floor area?
What counts as a lab building?
Where do I go for technical support?
How does adding my data to the database help the sustainable lab community?
How long will it take to enter my building's data?
What's the difference between logging in and viewing the data as a guest?
ENERGY STAR® Portfolio Manager® Connection
How do I import energy usage data from Portfolio Manager to LBT?
How do I link my Portfolio Manager account to my LBT account?
How do I link my Portfolio Manager Properties to my LBT Buildings?
Can I connect my LBT account to multiple Portfolio Manager accounts?
Can I connect my Portfolio Manager account to multiple LBT accounts?
Will the Portfolio Manager connection automatically backfill data for past years?
Can I overwrite data imported from Portfolio Manager?
Does the Portfolio Manager connection import other building properties, or just utility usage?
Can I import monthly utility usage data from Portfolio Manager or just annual?
When will automatic data import happen?
Can I upload data to Portfolio Manager from the LBT?
Why can’t more building data fields be imported from Portfolio Manager?
How do I know which of my LBT buildings are connected to Portfolio Manager?
How do I disconnect a Portfolio Manager building from the LBT?
What happens if I delete a linked building in LBT?
What happens if I remove the connection via Portfolio Manager?
Benchmarking Results
How much energy does a "normal" lab building consume?
Does I2SL issue certifications for high-performing buildings based on the benchmarking results?
How can I tell if my lab building is energy-efficient using the output of the LBT?
Does I2SL promote or recognize the best performing labs in a region?
Does the LBT provide guidance or recommendations for improving my lab building's performance?
How does the LBT account for differences in weather?
How does the LBT calculate source energy?
Is it better to benchmark my buildings based on site or source energy consumption?
Can I benchmark individual labs within my building?
Non-U.S. Locations and Metric Units
My building is outside of the US. Can I use the LBT?
How is the LBT determining my building's climate zone?
What exchange rates are assumed for the currencies in the LBT?
How do I switch the LBT between Imperial/US and Metric/SI modes?
The Labs2Zero Pilot Energy Score
What does the Pilot Energy Score represent and what counts as a good score?
How often is the Energy Score updated?
Is the dataset that the score is based on representative of the full spectrum of laboratories?
Why was source EUI used as the performance metric?
Is the Energy Score available for non-U.S. buildings?
Does the Energy Score apply to all types of labs?
What LBT fields are used to calculate the Energy Score?
How does the Energy Score account for weather and climate?
How can I provide feedback on the Pilot Energy Score?
Why should I provide feedback on the Pilot Energy Score?
Where can I read about the details of the Pilot Energy Score development?
What can I do if my building gets a bad score?
If my building gets a good score, can I get a certification?
Does the energy score take carbon emissions factors into account?
What does the Energy Score Target Setter assume for weather data?
The Labs2Zero Pilot Operational Emissions Score
What is the difference between location-based and market-based emissions?
What scopes of greenhouse gas emissions does the Pilot Operational Emissions Score include?
Why does the Pilot Operational Emissions Score not take market-based emissions into account?
How does the Pilot Operational Emissions Score differ from the Pilot Energy Score?
How does the LBT handle emissions factors for district energy sources?
How does the LBT handle emissions factors for the electricity grid?
Where can I read more about the development of the Operational Emissions Score?
Labs2Zero Embodied Carbon Benchmarking
What project types and building components does the LBT Embodied Carbon Benchmarking module support?
Does the Embodied Carbon Benchmarking module include embodied carbon data for MEP systems?
Should I include lab furnishings, fixed benches, moveable benches, or office furniture in my LCA?
What is I2SL’s plan to develop a Labs2Zero Embodied Carbon Score?
What metrics does LBT Embodied Carbon Benchmarking require from an LCA?
How does I2SL define lab area?
What is the scope of the requested LCA data?
What are the best practices for submitting my client’s project data?
How is I2SL considering resilience as it relates to embodied carbon?
How is embodied carbon for lab buildings different from other building types?
What life cycle scope is required?
Data Sources and Contents of the Peer Group
What are the data sources for the LBT?
Is the dataset a statistically representative sample of all U.S. laboratory buildings?
How much quality control is done on data in the database?
I'm a researcher interested in lab benchmarking. Can you send me the raw peer group data?
How often is the LBT database updated?
Are multiple years of data for each building shown on the charts?
Why is there not more system-level data for me to search?
Why aren't there more peer group labs in my climate zone?
Operational Practices Benchmarking
What does the Operational Practices Module do?
How do I use the Operational Practices Module?
Which fields can I view on the pie charts?
How do I enter Operational Practices data for my buildings?
Can I enter operational practices data for a building without entering energy data?
Can I still use the Operational Practices Module if I don't have any buildings in the tool?
Previous Versions and Improving the LBT
How can I suggest improvements to the LBT?
Are there any more planned upgrades for the LBT?
I'm interested in sponsoring enhancements to the LBT -- whom should I contact?
What happened to the old Labs21 Benchmarking Tool?
What happened to the data I entered into the old Labs21 Benchmarking Tool?
What happened to the Actionable Insights Module?
The Answers
Why Benchmark Lab Buildings?
Benchmarking means a number of different things in different contexts, even within the high-performance buildings world! The LBT is an example of whole-building energy benchmarking. The tool allows comparison of energy use and greenhouse gas emissions intensity (operational and embodied) between buildings with nominally similar functional requirements, either manually using the filters on the Analysis tabs, or automatically using the Labs2Zero Energy Score and Operational Emissions Score.
The LBT is designed to be used by a wide range of professionals, including facility owners, energy managers, consultants, architects, and design engineers. It can be used to benchmark labs from any industry sector, including commercial, academic, government, and healthcare sectors.
Why should I benchmark my lab building(s)?
There are a number of good reasons to benchmark building energy usage and greenhouse gas emissions. These include, but are not limited to:
- Prioritizing attention within a portfolio of buildings
- AIA 2030 reporting
- LEED O&M certification
- ASHRAE energy audits
- Providing context for public energy disclosure data
- Research and policy development
- Starting a conversation on building energy use and emissions.
The AIA 2030 Commitment refers me to Labs21 to develop a “regional
average” for my laboratory building project. How do I use the LBT for this purpose?
The 2030 Commitment is an excellent use for benchmarking data. The guidance for using the old Labs21 tool for LEED O&M is applicable to the 2030 Commitment. As described in that document, we recommend applying filtering criteria in a progressive manner until either a) all relevant criteria are selected or b) a minimum sample size (at least 12 comparables) is reached. It is important to maintain a minimum dataset for the data to be relevant; benchmarking against a small sample risks distorting the baseline. For obvious reasons, we recommend excluding estimated data. This is particularly important for the 2030 Commitment, a program that requires comparison to a statistical average of measured building performance data.
For very specialized projects with unusually energy-intensive performance criteria that the tool does not currently capture (e.g. cleanroom-dominated buildings), firms sometimes use engineering judgements based on their energy models rather than using tool data. We recommend contacting the AIA 2030 Commitment administrators for additional guidance in these rare cases.
Can the LBT be used for LEED O&M?
Yes. Please see this document for guidance on how to use the tool for LEED O&M certification. Please note that although the document was written some time ago for the old Labs21 tool, the procedure described is still valid.
Entering Data on Your Buildings
How do I enter my building’s data?
Just obtain a username and password via the link on the homepage, and then start entering your building’s data on the Your Buildings tab! The LBT Quick Start Guide will also help you get started.
What information should I have available before I
start to enter a new building?
The LBT includes a large number of data fields on each building. Some of these fields are mandatory, but most of them are optional. Refer to the LBT Quick Start Guide and/or the LBT Embodied Carbon Quick Start Guide to review the first set of fields you'll need to fill out. Please provide as many of the optional fields as you can! Please see this document for a full list of all LBT data fields.
What if I don't have all of the requested
information?
Most of the data fields are optional and are not required to complete your submission. Others are mandatory. If it turns out you don’t have everything needed, you can save your data (with draft entries for mandatory fields) and return later when you have the rest. If you’ve saved incomplete or placeholder data, it would be good to select “Test Data” as your entry in the Building Status field. Don’t forget to change this field to “Real Building” once the data submission is complete!
What if I have fiscal year energy use data, not
calendar year data?
You can enter fiscal year data. On the Utility and Emissions tab, just enter the end month of your fiscal year. The default end month is December (for calendar year data entry).
How do I account for my
district energy supply?
If the building is supplied by district energy sources (e.g. steam or chilled water), you should enter the amount of each district utility consumed by each building on the Utility and Emissions tab of the data entry page.
Can I input data over multiple sessions or do I need
to enter everything at once?
Your data entries are saved once you submit them. You can log out and then return to edit them at any time.
How can data entry be split between several
individuals at my organization?
To share data entry responsibilities, we recommend creating a single login for team members to share. Building data cannot at present be shared between different user accounts, but we plan to add this functionality in future.
Is it possible to upload data for several buildings at once? Is there a bulk data upload option?
There is currently no bulk data upload option, but we'd like to add one in future.
The LBT considers lab area to consist of those spaces in which experiments take place and where special ventilation conditions (such as single-pass air) or other special conditions (such as tight temperature control and high air recirculation rates) are required. This definition is intended to include open labs and support spaces such as equipment rooms, procedure rooms, vivarium holding rooms, etc. It also includes physics labs, maker spaces, and cleanrooms, which may include recirculated air. It does not include language labs, computer labs, office space, utility space, or other non-lab spaces. Total lab area is normally less than 50% of building gross area.
What counts as a lab building?
For the purposes of the LBT, a lab building is a building containing lab space as defined in the answer above. To obtain meaningful results, it is recommended that the LBT is used only when the total lab area fraction (total lab area as a fraction of gross area) exceeds approximately 10 percent.
What is the difference between net and gross floor area?
Gross floor area (also known as gross square footage) is the total floor area of the building, excluding open spaces such as parking garages and guard shacks. Net floor area includes net assignable space only, i.e. it excludes circulation spaces, restrooms, mechanical rooms, etc. Net floor area is always smaller than gross floor area. Note that gross floor area is a required data entry in the LBT, while net floor area is optional.
Where do I go for technical support?
We hope that this site is intuitive to use! However, if you have problems with the website, or if you have a question that is not answered in these FAQs or in the informational tooltips spread throughout the site, please contact lbt@i2sl.org.
How does adding my data to the database help the
sustainable lab community?
It helps a lot! The vast majority of buildings in the database are user-submitted. The more buildings we have in the tool, and the more detailed data we have on each building, the greater chance every user has to select a large sample of peer buildings for benchmarking. The anonymized LBT dataset was also used to develop the Labs2Zero Energy and Operational Emissions Scores. Without user submissions, these could not exist.
How long will it take to enter my building's
data?
Not long! If all energy usage and building area data are available, and the user is familiar with the building, we estimate a reporting burden of 15 minutes per building. Please see the LBT Quick Start Guide for a description of the data you will need to get started.
What's the difference between logging in and viewing the data as a guest?
Registered users can log in to enter and save data on their own buildings, which will then appear alongside peer-group buildings on the benchmarking charts. Registration is free! If you don't own buildings, or would prefer to explore the peer-group database on its own, you may view the data as a guest.
ENERGY STAR Portfolio Manager Connection
How do I import energy usage data from Portfolio Manager to LBT?
There are a few different ways to do this, but they all happen on the Utility and Emissions tab of an LBT building once you’ve set up a link between your LBT and Portfolio Manager accounts and a link between each building and its corresponding Portfolio Manager facility. Please see the Setup Instructions page for a step-by-step guide.
How do I link my Portfolio Manager account to my LBT account?
Setting up the connection is simple and involves just a few steps. Please see the Setup Instructions page for a step-by-step guide.
How do I link my Portfolio Manager Properties to my LBT Buildings?
Once you’ve linked your Portfolio Manager and LBT accounts, linking individual buildings is simple and involves just a few more steps. Please see the Setup Instructions page for a step-by-step guide.
Can I connect my LBT account to multiple Portfolio Manager accounts?
Yes, just follow the same linking procedure for each Portfolio Manager account.
Can I connect my Portfolio Manager account to multiple LBT accounts?
No, you can only connect each Portfolio Manager account to one LBT account.
Will the Portfolio Manager connection automatically backfill data for past years?
No, LBT will not backfill past years. LBT will try to download any data with Data Year equal to the current calendar year and will then download data following the end of each future data year. The LBT’s Portfolio Manager Connection module will never automatically overwrite any data you manually entered for your buildings. For any other years, you can backfill data manually by adding a data year via the Your Buildings tab and importing energy usage data from the Utility and Emissions tab for the data year. See also below for some examples of data import timing.
Can I overwrite data imported from Portfolio Manager?
Yes. Your data will never be automatically overwritten by the LBT, and you can always enter your own utility usage data or overwrite data imported from Portfolio Manager.
Does the Portfolio Manager connection import other building properties, or just utility usage?
If you create a new building from a Pending Building in the Portfolio Manager tab, a few other data fields will be imported. These include building name, address, and gross floor area. This is the only case in which data other than annual utility usage is imported from Portfolio Manager.
How does the LBT handle fuel types in Portfolio Manager that aren’t included in the LBT (e.g. wood, specific fuel oil grades)?
Fuel types not included in the LBT list are imported from Portfolio Manager (in kBtu) and summed. These then appear in the Other Fuels LBT data field (in MMBtu).
Fuel oil usage in Portfolio Manager is summed across grades (all in kBtu) and imported into the Fuel Oil LBT data field. Fuel oil in the LBT can be displayed in MMBtu or gallons (using a conversion factor of 0.138 MMBtu/gal, typical for Fuel Oil #2), but is always saved in MMBtu. For this reason, the specific MMBtu/gal factor does not affect the Portfolio Manager data import.
Can I import monthly utility usage data from Portfolio Manager or just annual?
You can only import annual data from Portfolio Manager at this time, but note that you should choose the End Month that works with your accounting system (if you don’t use calendar years).
When will automatic data import happen?
LBT will start trying to import data following the end of each data year, i.e. immediately following the end of the End Month you entered for the building. If Portfolio Manager does not yet contain a full year of data for that year, no data will be imported and LBT will continue trying (once per day) to import data. Note: where data years are split across calendar years, the Data Year is taken to be the year containing the final month of the dataset.
Two examples of auto data import timing are given below:
- Example 1: You create Building 1 in the LBT at the same time as you connect it to Portfolio Manager in November 2022 and enter the End Month as August. As part of the building setup process you import PM data for Data Year 2022. In September 2023, LBT will then start trying to import data for Data Year 2023 (Sep 2022 - Aug 2023). In September 2024, LBT will start trying to import data for Data Year 2024, and so on in future years.
- Example 2: Building 2 already has data for 2018 and 2019. You connect it to Portfolio Manager in October 2022 and enter the End Month as July, and you import Data Year 2020 data from Portfolio Manager. The next day, LBT will start trying to import data for Data Year 2022 (Aug 2021 - Jul 2022). In August 2023, LBT will start trying to import data for Data Year 2023, and so on in future years.
Can I upload data to Portfolio Manager from the LBT?
No. At this time, data transfer is only from Portfolio Manager to the LBT.
Why can’t more building data fields be imported from Portfolio Manager? I entered so much information there!
Other than energy data, there’s just not that much overlap in fields collected by these two tools. Most of the other fields in Portfolio Manager are not particularly helpful for benchmarking lab facilities against each other, so there’s little point in importing them to LBT. And most of the fields that LBT needs for you to meaningfully benchmark lab buildings (e.g. number of fume hoods, types of lab space) aren’t fields that are currently collected by Portfolio Manager. Note: If you create a new building from a Pending Building in the Portfolio Manager tab, a few other data fields will be imported. These include building name, address, and gross floor area. This is the only case in which data other than annual utility usage is imported from Portfolio Manager.
How do I know which of my LBT buildings are connected to Portfolio Manager?
Visit the Your Buildings tab in LBT. Buildings with a Portfolio Manager link have an additional "Edit Settings" button at the right of the table. Alternatively, visit the Portfolio Manager tab of the LBT, where linked buildings are listed under the Connected Properties sub-tab.
How do I disconnect a Portfolio Manager building from the LBT?
From the Connected Properties tab on the Portfolio Manager page, click the Unlink Property button. Any building data previously imported from Portfolio Manager will remain in the LBT, but the connection will be broken.
What happens if I delete a linked building in either the LBT or Portfolio Manager?
Deleting a linked building in the LBT will break the link to Portfolio Manager. Deleting a linked building from Portfolio Manager has the same effect as cancelling the connection from Portfolio Manager: the link will disappear from LBT. If you don’t immediately see the link disappear from the Your Buildings tab, please visit the Portfolio Manager tab of the LBT. This will cause the data to update and you should then see the link disappear from the Your Buildings tab too.
What happens if I remove the connection via Portfolio Manager?
If you cancel the connection via Portfolio Manager, the link will disappear from the LBT too. If you don’t immediately see the link disappear from the Your Buildings tab, please visit the Portfolio Manager tab of the LBT. This will cause the data to update and you should then see the link disappear from the Your Buildings tab too.
Benchmarking Results
How much energy does a “normal” lab building
consume?
“Normal” depends on what kind of lab building we’re talking about – that’s one of the big reasons we need a lab benchmarking tool! Explore the dataset using the LBT's Benchmarking Analysis tools to see what's normal for the type of lab building you're interested in!
How does the LBT differ from Portfolio
Manager?
Both Portfolio Manager and the LBT will accept and store building data (building properties and energy usage information). There are a number of differences, but the most significant one for lab building owners is that Portfolio Manager does not currently collect lab-specific information such as percent lab area, lab type, or lab purpose. For this reason, any comparison between lab buildings made via Portfolio Manager is not a true comparison between peer buildings with similar functional requirements. The LBT is the only benchmarking tool to include lab-specific functional requirements to allow true benchmarking (via scores and filters) for lab buildings.
Does I2SL issue certifications for high-performing buildings using the benchmarking results?
Not yet, but a certification system will be added as part of I2SL's Labs2Zero program. Stay tuned!
How can I tell if my lab building is energy-efficient using the output of the LBT?
Whole-building energy benchmarking is a high-level exercise that’s well suited to identifying good candidates for follow-up investigation. Generally speaking, if your building has a higher energy use intensity than a peer group of similar buildings, or a low Labs2Zero Energy Score, then it may be a good candidate for a closer look at its energy consumption. Note that high energy consumption may also be a symptom of an energy-intensive functional requirement that was not taken into account – that’s why a follow-up is a good idea. Buildings with high energy efficiency would generally be expected to have lower energy intensity than otherwise similar facilities.
Does I2SL promote or recognize the best performing labs in a region?
Information entered by users of this tool is not currently used to recognize individual facilities based on their reported energy consumption. I2SL celebrates high achievement in lab sustainability via its annual awards program, which includes a category for exceptional projects carried out in laboratory or other high-tech facilities.
Does the LBT provide guidance or recommendations for improving my lab building's performance?
We recognize that important actionable insights can be gained from the types of benchmaking data collected by the LBT. These insights can help to bridge the gap between benchmarking and taking real action to achieve performance improvements. The Labs2Zero Actionable Insights and Measures Report Tool will provide this type of insight along with detailed savings estimates. The AIM Report Tool is currently under development - stay tuned!
The application of data filters is limited by the
number of data points. Have you investigated the use of normalization techniques so that the entire data set can
be utilized to provide a more “apples to apples” comparison?
Yes -- the Labs2Zero Energy Score does just that (as does the Operational Emissions score). Please see the About the Scorecard page on the LBT site.
How does the LBT account for differences in
weather?
You can filter the dataset by climate zone, but the data shown in the charts is not weather normalized. However, the Labs2Zero Energy Score (and Operational Emissions Score) does include a weather correction.
How does the LBT calculate source energy and GHG
emissions?
Source energy consumption is calculated using the same factors as those used in ENERGY STAR Portfolio Manager. The factors from the August 2023 ENERGY STAR publication are used for all data years in the LBT.
Is it better to benchmark my buildings based on site
or source energy consumption?
To compare the energy usage of different buildings, it is helpful to combine energy usage data from different sources (e.g. electricity, district chilled water, natural gas) into a single building energy consumption metric. A number of metrics are in common use: site energy includes only the energy consumed at the building itself; source energy also includes the energy used to generate and transmit the energy used on site; and GHG emissions and energy cost, both typically closely related to source energy consumption, are also used frequently. No single metric is the best approach for all situations.
If you’re only benchmarking against buildings with the same energy sources (e.g. if all buildings in the benchmarking sample are connected to the same campus central plant) then it doesn’t matter too much whether site or source energy consumption is used. Otherwise, and certainly when using the tool, source energy (or GHG emissions) is the better basis for comparison. The dataset contains buildings with many varied energy sources, and a comparison based on site energy will tend to introduce distortions because the site energy usage of some buildings includes the energy used to generate utilities (e.g. if the building contains chillers or boilers) while for others it does not (e.g. chilled water or steam received from a central plant).
The use of source energy as a metric for comparison acts to alleviate these distortions. The tool uses standard ENERGY STAR conversion factors between site and source energy. The use of standard factors means that the efficiencies of individual central plants are not taken into account. This approach is preferable because it provides a more equitable comparison between the lab buildings themselves and not the district energy plants to which they are connected.
Can I benchmark individual labs within my
building?
No. The LBT is designed to be used with whole building energy usage data and it should not be used for individual labs within buildings.
Non-U.S. Locations and Metric Units
My building is outside of the US. Can I use the LBT?
Yes, as of October 2022 the LBT now accepts non-US buildings and currencies. The peer group database is still mostly comprised of U.S. buildings, but you are now able to compare your lab buildings with the peer group regardless of where your facility is located. As more international facilities are entered into the database, you’ll be able to compare with more facilities around the world.
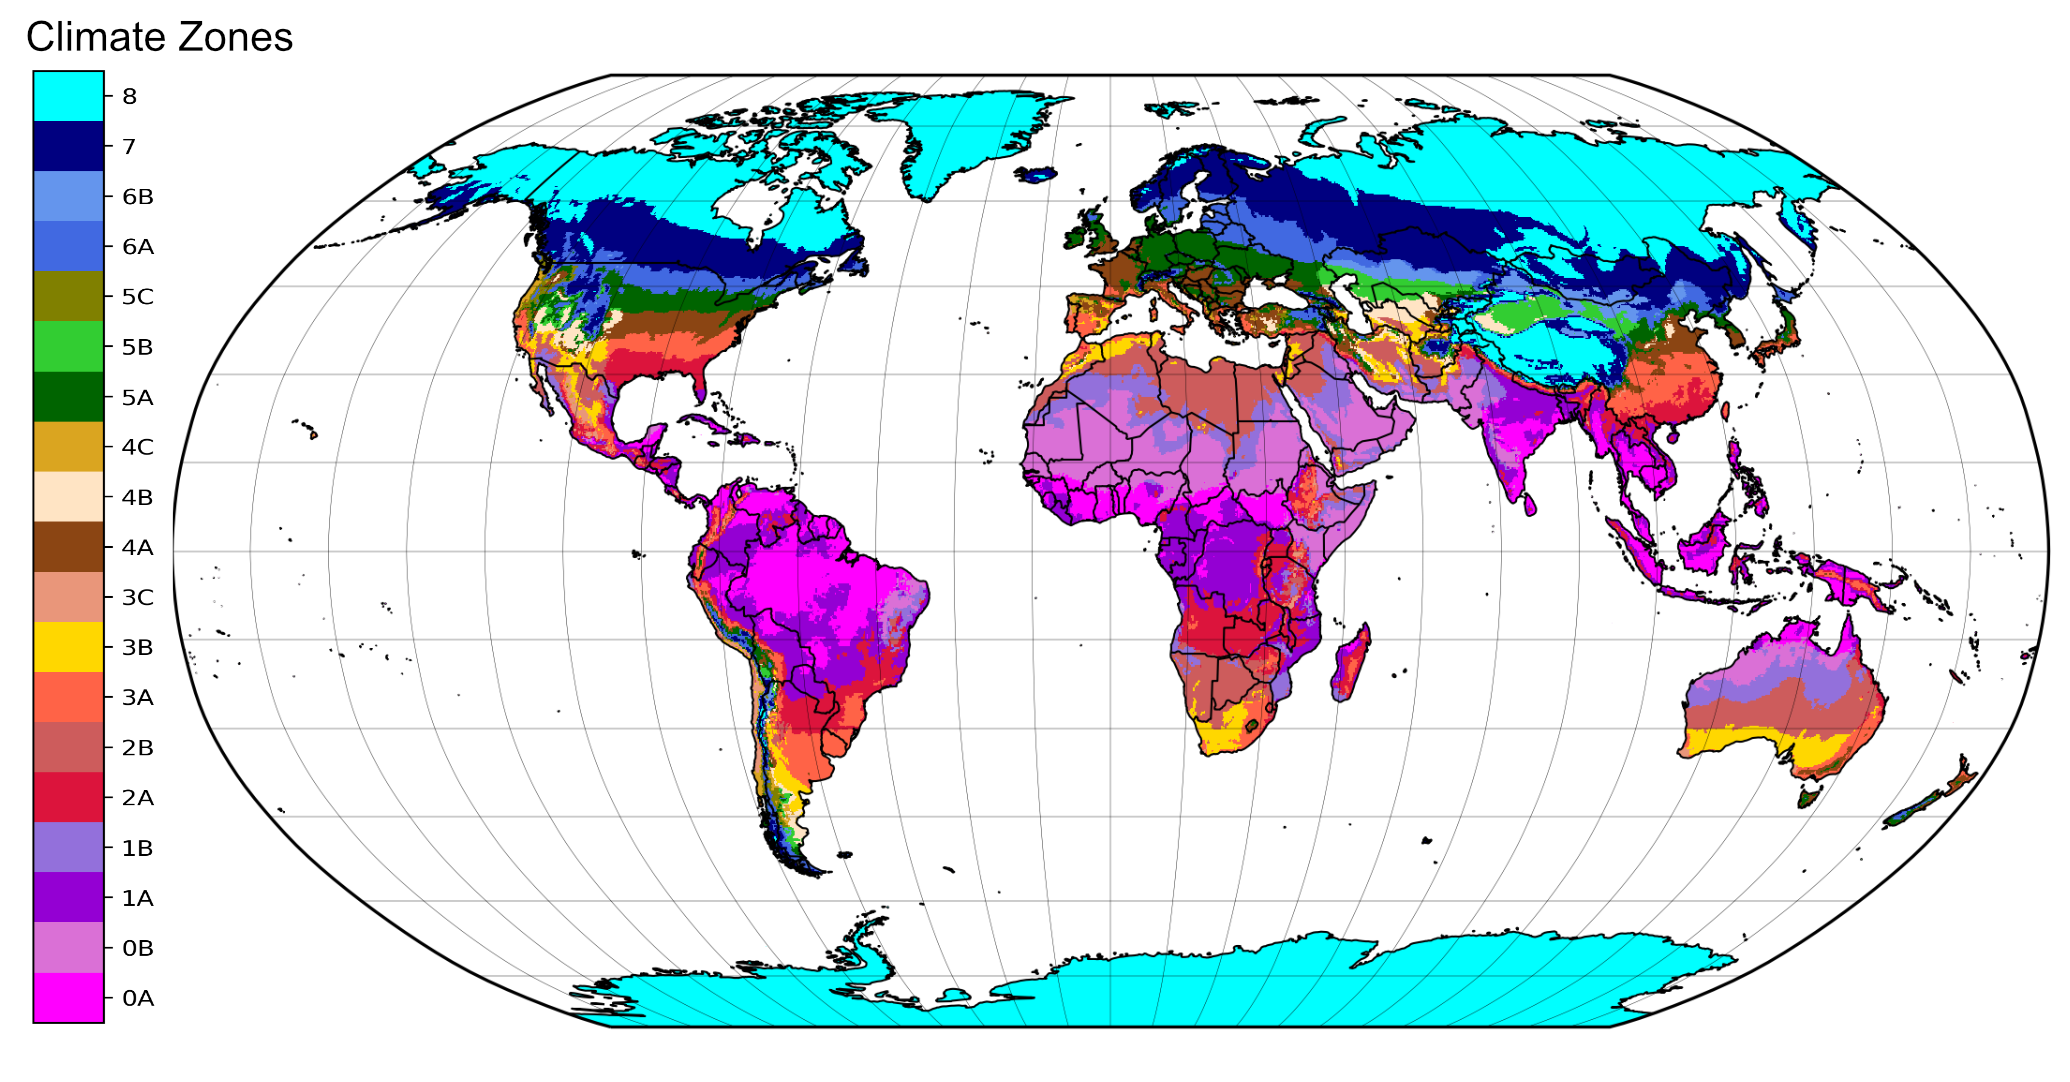
How is the LBT determining my building’s climate zone?
The LBT is using ASHRAE Standard 169-2021 to determine climate zones for buildings. The closest listed climate zone location to the entered address is used to assign the climate zone for each building. Note that the climate zone designation for many global zones was updated versus previous years, so some buildings’ calculated climate zones have changed. Also note that buildings are assigned their current climate zone for all entered years of data in the LBT.
What exchange rates are assumed for the currencies in the LBT?
Exchange rates for 1 September 2022 were used (taken from currencyfreaks.com); these are not “live” values, but they may be updated periodically.
The metric or SI system of units is the world's most widely used system of measurement. Common metric units used in the building energy industry include kWh for all types of energy and square meters for areas.
Imperial or US units are used chiefly in the US, but are also sometimes used alongside metric units in some other countries. Common US units used in the building energy industry include Btus for many energy quantities and square feet for areas.
How do I switch the LBT between Imperial/US and Metric/SI modes?
Use the dropdown menu marked with a globe icon (top right of each page) to switch between Imperial/US and Metric/SI options. The page will reload when you change the unit selection. If you are logged in, your unit preference will be saved to your LBT account profile.
The Labs2Zero Pilot Energy Score
What does the Labs2Zero Pilot Energy Score represent and what counts as a good score?
The Pilot Energy Score is a rating of a laboratory building’s energy performance relative to its peers. The 1-100 score is a percentile ranking, meaning that a score of 80 (which should be considered a good score) indicates that the energy performance of that building is better than 80% of buildings in the LBT peer group database.
How often is the Energy Score updated?
The Labs2Zero Energy Score algorithm is currently a pilot version that is planned to be updated and re-released as Version 1 of the Labs2Zero Energy Score in late 2024. The need for future algorithm updates will be evaluated periodically, and any updates will be communicated to LBT users. Between score updates the score algorithm is static, i.e. your score will not change outside of these updates.
Is the dataset that the score is based on representative of the full spectrum of laboratories?
The LBT dataset is understood to be the largest and most complete publicly available dataset relating to lab building energy performance. While the LBT peer group is not strictly a statistically representative sample, it does include a broad cross-section of lab types across many (mostly U.S.) geographies, and there is no reason to believe that that dataset is biased towards any particular building characteristics (e.g., chemistry labs, high-performance lab buildings). Where the Energy Score is not yet well-tuned to particular types of lab building, the pilot scores for those building types are provided with caveats explaining these limitations.
Why was source EUI used as the performance metric?
LBNL researchers, in collaboration with I2SL’s Energy Score Technical Advisory Council (TAC), reviewed proposals for several candidate performance metrics and selected source energy use intensity for multiple reasons. Reasons include the desire to properly weight different energy sources in a way that reflects their primary energy consumption; to treat energy use in a similar way to the familiar scoring systems developed by ENERGY STAR for other building types; and to accommodate district and campus heating and cooling plants, which are very common energy sources for lab buildings.
Is the Labs2Zero Pilot Energy Score available for buildings outside the United States?
The Pilot Energy Score is provided for buildings inside and outside of the United States. Note that the score was developed using data from buildings in the United States, so the score represents a building’s performance relative to peer facilities in the United States, not necessarily its peers in its own country.
Does the Labs2Zero Pilot Energy Score apply to all types of labs?
The Pilot Energy Score is available for all types of lab buildings, but the score is not reliable for all lab building types. For buildings where the pilot score calculation is known to be unreliable or incomplete (examples include vivarium-dominated facilities and crime labs), a warning message is provided on the Building Details page for the relevant building. Additional data on these building types will help I2SL to further tune the scoring system, so please consider entering data for these types of lab facilities via the LBT.
What LBT fields are used to calculate the Labs2Zero Pilot Energy Score?
The Pilot Energy Score calculation uses occupied hours per week, facility type (R&D, teaching, etc.), net lab area, lab use type (biology, physics, etc.; this is calculated from component lab areas), energy use data, and location (which is used to obtain weather data for the data year specified). Please make sure that these fields are entered accurately so you can obtain a representative Pilot Energy Score.
How does the Labs2Zero Pilot Energy Score account for weather and climate?
The Pilot Energy Score algorithm includes a weather correction factor that was developed based on an analysis of the full LBT peer group dataset. The calculation uses annual cooling degree days (CDD, base 65F) obtained from degreedays.net, based on the best available weather station using a building’s latitude and longitude or zip code.
How is the Labs2Zero Pilot Energy Score similar to/different from the ENERGY STAR Score, the AASHE STARS program, and other ratings?
ENERGY STAR does not currently offer a score for lab buildings. ENERGY STAR scores for other building types are based on Commercial Building Energy Consumption Survey (CBECS) data. The Labs2Zero Pilot Energy Score followed a score development methodology similar to that used for ENERGY STAR and was based on LBT peer group data. AASHE STARS is a university campus sustainability recognition program that is not specific to labs. AASHE supports I2SL’s efforts.
How does the Labs2Zero Pilot Energy Score fit in with other green building rating programs, or supplement their ratings when labs account for a significant portion of a building’s energy use?
Many existing programs have prescriptive requirements for measuring energy performance. I2SL is actively engaging a variety of organizations to promote coordination and support of the Labs2Zero Energy Score.
Does the Labs2Zero Pilot Energy Score account for data errors in the LBT peer group that was used to develop the score?
There are a variety of data validation processes that prevent users from entering incorrect data into the LBT. Additional data checks are done before buildings are entered into the LBT peer group dataset (the dataset that was used to generate the scoring system). Further, LBNL researchers removed all buildings with energy usage marked as "estimated" from the score development analysis.
How can I provide feedback on the Labs2Zero Pilot Energy Score?
Please email I2SL at lbt@i2sl.org with any feedback on the Labs2Zero Pilot Energy Score, or with any bug reports or questions about the LBT. Thank you for helping I2SL to improve our Labs2Zero program.
Why should I provide feedback on the Labs2Zero Pilot Energy Score?
With your feedback, I2SL can work to improve the scoring methodology so that it provides a fair and accurate score for as broad a range of lab buildings as possible. Please submit your buildings’ data to the LBT and send us your feedback at lbt@i2sl.org.
Where can I read about the details of the Labs2Zero Pilot Energy Score development?
The technical details of the Labs2Zero Pilot Energy Score development process are described in this white paper from researchers at Lawrence Berkeley National Laboratory (LBNL).
What can I do if my building gets a bad score?
If you feel that your building has received a bad score in error, please let us know at lbt@i2sl.org. During the pilot phase, we are actively soliciting feedback from LBT users to help us improve our scoring methodology. If you feel that your building has justifiably received a bad score, please see the extensive resources on the I2SL website detailing ways to save energy in lab buildings. In the future, Labs2Zero will offer customized reports to help you identify opportunities to improve your buildings’ performance.
If my building gets a good score, can I get a certification?
Not yet. The Labs2Zero program plans to offer certifications for lab energy and emissions performance, but this part of the program has not yet been launched. Stay tuned for more news as we develop these program features.
Why does the score not take other building properties into account, such as number of fume hoods or required ventilation rates?
The Labs2Zero Pilot Energy Score was based on a statistical analysis of the LBT peer group database of labs. The analysis included parameters such as the fume hood density and required minimum ventilation rates, but it was found that these were not statistically significant predictors of typical building energy usage. That does not mean that ventilation rates and fume hood density do not affect the energy usage of a given building, but it does mean that they could not appear in the pilot scoring system. I2SL will continue to collect data during the pilot phase and will revisit these parameters at the close of the pilot.
Does the Labs2Zero Energy Score take carbon emissions factors into account?
No, the Labs2Zero Pilot Energy Score only takes energy usage into account. Greenhouse gas emissions are taken into account in the Labs2Zero Operational Emissions Score (see the relevant section of these FAQs).
What does the Energy Score Target Setter assume for weather data?
The Target Setter uses weather data for calendar year 2023 for the closest available location to the address entered for the building.
If I enter an In Design or In Construction building, what does the LBT use for weather data to compute the Labs2Zero scores?
To calculate the Pilot Energy Score and Pilot Operational Emissions Score for buildings that are In Design or In Construction (and that therefore do not have a data year assigned to them), the LBT uses weather data for calendar year 2023 for the closest available location to the address entered for the building.
The Labs2Zero Pilot Operational Emissions Score
What does the Labs2Zero Pilot Operational Emissions Score represent, and what counts as a good score?
The Pilot Operational Emissions Score is a rating of a laboratory’s location-based greenhouse gas (GHG) emissions performance relative to its peers. The 1-100 score is a percentile ranking, meaning that a score of 80 (which would be considered a good score) indicates that the location-based GHG emissions performance of that building is better than 80 percent of its peers in the LBT database.
What is the difference between location-based and market-based emissions?
These are two different methodologies for calculating indirect greenhouse gas emissions (typically for purchased electricity). A location-based methodology uses the emissions intensity of the electricity grid where consumption occurs, as well as specific emissions factors applied to district heating and cooling. Location-based emissions do not include market instruments, such as renewable energy certificates (RECs). A market-based methodology includes market instruments such as RECs and other purchases an organization may make to abate its greenhouse gas emissions. The two quantities, location-based and market-based emissions, are often presented as a pair of values in greenhouse gas reporting.
What scopes of greenhouse gas emissions does the Pilot Operational Emissions Score include?
The Operational Emissions Score includes emissions from the Scope 1 and 2 categories. Scope 1 emissions are direct emissions from sources that an organization owns or controls, such as stationary combustion in buildings. Scope 2 emissions are indirect emissions from sources that an organization owns or controls, such as purchased electricity. There are no plans to include Scope 3 emissions in the Operational Emissions score or in the LBT at this time.
Why does the Pilot Operational Emissions Score not take market-based emissions into account?
The Pilot Operational Emissions Score is a location-based score only. This is related to data availability: there is currently insufficient data in the LBT on market-based purchases made by lab building owners. I2SL updated the LBT in spring 2024 to begin collecting data on fields needed to calculate market-based emissions, such as amounts of purchased renewable energy credits, energy attribute certificates, and carbon offsets. Once we have collected sufficient data on these market-based quantities, I2SL intends to develop a market-based Operational Emissions Score to sit alongside the location-based score.
Does the Pilot Operational Emissions Score take process emissions or fugitive emissions into account?
No, the Pilot Score is based only on building-related emissions. This is largely because of data availability: at the time of developing the Pilot Score, the LBT dataset did not contain information on these emissions sources. The LBT was modified in Spring 2024 to start collecting data on these quantities and I2SL intends to revisit their inclusion in the scoring system once sufficient data has been collected.
How does the Pilot Operational Emissions Score differ from the Pilot Energy Score?
The Pilot Operational Emissions Score is built on the Energy Score calculation. The two scores use the same adjustment factors for a building's functional requirements. The Allowed Source EUI from the Energy Score formulation is then converted into an Allowed GHGI for the Operational Emissions Score. This Allowed GHGI is compared to the building's Actual GHGI, which is calculated using emissions factors for the electrical grid and other utilities consumed by the building.
How does the LBT handle emissions factors for district energy sources?
For district hot water and steam, the LBT uses the standard ENERGY STAR emissions factor for the U.S. of 0.0664 kgCO2e/kBtu from August 2023. For district chilled water, the LBT starts with the ENERGY STAR U.S. average factor for electric chillers and adjusts it proportional to the local eletrical grid intensity, i.e. the district chilled water emissions factor is taken to be 0.0527 kgCO2e/kBtu x (local grid intensity) / (U.S. average grid intensity).
How does the LBT handle emissions factors for the electricity grid?
For a given location, all years of data are currently assigned the same emissions factor. For U.S. locations, the LBT uses the building's address to look up the corresponding grid region using data from eGRID's Power Profiler tool. The eGRID zipcode lookup tables were used in conjunction with 2021 grid emissions values. For non-U.S. locations, the LBT uses the 2023 country-specific grid emissions factor (Scope 2) value from carbonfootprint.com. In future, I2SL intends to add more granular grid data for some countries beyond the U.S. In the meantime, you can overwrite the automatically assigned grid value via the Utility and Emissions data entry tab if you can supply a more appropriate grid emissions factor.
Where can I read more about the development of the Operational Emissions Score?
The technical details of the Labs2Zero Pilot Operational Emissions Score development process are described in this white paper authored by the researchers at LBNL who led the score development effort.
My organization is focused on electrifying our buildings but some of our buildings are located in an area with a relatively dirty electrical grid. How will this impact their Operational Emissions Scores?
If your lab building is located in an area where the electricity grid is more carbon-intensive, and your building's energy mix relies heavily on electricity, this will lead to a lower Pilot Operational Emissions Score. However, to recognize lab buildings that are working toward beneficial electrification, a hypothetical “clean grid” score is shown on the Building Details page. This score shows what the building’s location-based Pilot Operational Emissions Score would be if it were located on a carbon-free electric grid.
Labs2Zero Embodied Carbon Benchmarking
What project types and building components does the LBT Embodied Carbon Benchmarking module support?
I2SL is currently prioritizing structure and enclosure/shell data for major renovations and new construction projects. This will be expanded to include other project types and building components, such as minor renovations, tenant fit-outs, interiors, and MEP systems, in future.
Does the Embodied Carbon Benchmarking module include embodied carbon data for MEP systems?
The current version does not include embodied carbon in mechanical, electrical, and plumbing (MEP) systems. I2SL plans to consider MEP system embodied carbon in future iterations. This aligns with the Carbon Leadership Forum’s (CLF) v2 Benchmarking Study, which excluded MEP system data.
Should I include lab furnishings, fixed benches, moveable benches, or office furniture in my LCA?
The current version of the LBT Embodied Carbon Benchmarking module does not include any data on interiors. This will be considered for a future version.
What is I2SL’s plan to develop a Labs2Zero Embodied Carbon Score?
The release of the Embodied Carbon Benchmarking module will support the life cycle assessment (LCA) data collection necessary for the development of an Embodied Carbon Score for labs, tentatively planned for early 2025.
What if I do not have any whole-building LCAs for lab buildings, but have embodied carbon analysis studies for structural building components and envelope?
The minimum scope for the current module is structure & enclosure (substructure, shell-superstructure, exterior enclosure) for the product stage (A1-A3). We plan to consider more granular reporting in the future
What metrics does LBT Embodied Carbon Benchmarking require from an LCA?
Only global warming potential (kgCO2e) is required.
How does I2SL define lab area?
Please see this FAQ. Core and shell projects somtimes do not have values for total lab areas because the lab space has not yet been designed. In these cases, users should provide an estimate of the total lab area. The LBT average total lab area is around 40% of gross floor area; note that this value rarely exceeds 50% in reality.
What is the scope of the requested LCA data?
The Labs2Zero program aligns with the LEED pilot credit for the procurement of low carbon construction materials (MRpc132). The following materials must be aggregated in the kgCO2e/sq.m metrics provided if they are used on the project:
- Concrete (ready mixed concrete, slurry, shotcrete)
- Masonry (CMU)
- Steel (rebar, steel wire and mesh, plate steel, structural steel, steel decking, cold formed steel, open-web steel joists)
- Aluminum (aluminum extrusions, thermally improved aluminum extrusions)
- Wood & Composites (dimensional lumber, plywood/OSB sheathing, glass mat gypsum sheathing, prefabricated wood products, composite lumber, mass timber)
- Insulation (board, blanket, foamed-in-place, blown)
- Cladding (insulated metal panel, metal panel)
- Bulk Materials (flat glass)
What are the best practices for submitting my client’s project data?
The Labs2Zero Embodied Carbon Technical Advisory Council (TAC) recognizes that obtaining client permission to share data can be a challenge. SOme best practice options include: sending an email to the client letting them know that your organization commits to sharing anonymous project data as part of their sustainability program (and offering an opt-out for the client); or sending the client a form asking if they will opt into publicly sharing project data. Some organizations have determined, in consultation with their general counsel, that sufficiently anonymized data is no longer considered proprietary and can therefore be shared.
I2SL and Lawrence Berkeley National Lab (LBNL) staff will periodically review user-submitted data and add selected data to the anonymized peer group that other users can search and use to benchmark their projects. I2SL will also use the data to help develop a Labs2Zero Embodied Carbon Score, which will be available via the LBT for all submitted projects.
How is I2SL considering resilience as it relates to embodied carbon?
I2SL plans to use project location information, seismic design criteria, and design wind speed in future analysis to determine how the Embodied Carbon Score will incorporate resilience factors. I2SL’s Best Practice Guide: Laboratory Resilience from March 2021 provides additional detail on resilience in lab buildings.
How is embodied carbon for lab buildings different from other building types?
Lab buildings have unique functional requirements that can often drive design decisions. One common example is that labs often have more stringent vibration criteria to accommodate sensitive equipment and processes, which can result in an increase in structural materials.
What life cycle scope is required?
Projects are required to submit embodied carbon intensity (in kgCO2e/sq.m) for the product life cycle stages, A1-A3. Other life cycle stages are included as optional fields but are not displayed as benchmarking options at this time.
What are the job titles or positions of people who are most likely to have the required data for submission to the LBT?
Project design engineers, architects, or sustainability consultants may have access to the required LCA data and lab program information. The project structural engineer is likely to have the structural data (optional fields) requested in the LBT.
Data Sources and Contents of the Peer Group
What are the data sources for the LBT?
The peer group data in the LBT was provided by a wide range of laboratory owners and operators, mostly in the United States. These include federal government agencies, universities, pharmaceutical companies, and other organizations. Identities of the buildings and organizations in the database are masked for confidentiality. The database also includes selected buildings from the U.S. Department of Energy’s Commercial Buildings Energy Consumption Survey (CBECS) dataset.
Is the dataset a statistically representative sample
of all U.S. laboratory buildings?
No. The dataset is the largest known collection of lab-specific building data, but it is not designed to be a statistically representative sample of the U.S. building stock.
Are the energy use data points in the LBT measured or
estimated?
For most buildings, the building-level energy use data is measured data from building-level utility meters. You can use the filters on the Energy and Operational Emissions Benchmarking page to select whether you want to see measured and/or estimated data on your charts. Data labeled as “estimated” is typically based on allocations made where buildings do not have dedicated utility meters.
Yes. All user input data is treated as confidential. The only people with access to the database are technical staff responsible for the database and this website. The identities of peer group buildings in the benchmarking charts are masked. Furthermore, only normalized metrics are shown (e.g. kBtu/sf/yr); the raw data points from which metrics are calculated (e.g. building area) are not displayed on the charts.
How much quality control is done on data in the
database?
LBNL staff perform reviews of all new submissions of data for inclusion in the peer benchmarking dataset. Records that are clearly incorrect (e.g. energy intensity outside of reasonable bounds) or trial entries (marked by user as test data) are not included. However, no detailed auditing is performed to confirm that submitted buildings are real or that data has been entered accurately.
I'm a researcher interested in lab benchmarking. Can
you send me the raw data?
No. You are welcome to use the publicly available (anonymized) data using the filtering tools on the site, but we cannot share the raw data.
How often is the database updated?
LBNL staff review user-submitted data periodically, typically twice a year. The searchable peer group database is updated after each data review.
Are multiple years of data for each
building shown on the benchmarking charts?
No. Only the most recent year of data (or the latest contstruction phase) is shown for each building in the peer group database and for users' own buildings. Viewing of “longitudinal” data can be done for your own buildings on the Building Details page for that building.
Aren't all the data sources really old?
Definitely not. Although the dataset includes the Labs21 peer group, which contained data from as early as 2002, most of the entries are much more recent. Many users update their building data each year, and new facilities are added to the peer group database every year.
Why is there not more system-level information for me to
search?
System-level data entry is not mandatory, so a limited amount of it has been submitted. Please provide whatever system level data you can, so we can improve the quality and breadth of the dataset for all users!
Why aren't there more peer group labs in my climate
zone?
Most likely because users in your climate zone have not submitted much building data to the LBT. Please submit yours, and encourage your neighbors to do the same!
Operational Practices Benchmarking
What does the Operational Practices Module do?
The Operational Practices module goes beyond energy benchmarking to allow you to compare the operational practices and policies at your buildings with those of your peers. The module includes 23 questions, such as 'Does this building have an energy manager?' and 'Are filtering fume hoods in use?' The pie charts on the Operational Practices page let you see how your answers to these questions compare to those of your peers.
How do I use the Operational Practices Module?
The Operational Practices tab works in the same way as the Energy and Operational Emissions Benchmarking tab. Select a question to which you'd like to see the answers, and then use the filters at the right to select buildings that are similar to yours. Only buildings that meet the filter conditions AND have an answer to the selected question will appear on the pie charts. Mouse over the pie charts to see percentages and other info. Your own buildings are identified by name in the table underneath the pie chart (click on the down arrows on the right of the rows to expand). For your own buildings, please answer the Operational Practices fields via the Your Buildings tab of the LBT. The Operational Practices fields are labeled with a blue 'OP' symbol on the Edit/Add building pages.
Which fields can I view on the pie charts?
A set of 23 priority fields can be viewed via the pie charts. Please click on the dropdown menu labeled 'Select Property to Plot' to see the list and select a field of interest to you.
How do I enter Operational Practices data for my buildings?
All of the Operational Practices questions are included in the data entry forms in the Your Buildings tab. The Operational Practices fields are marked with a blue 'OP' sign. One important thing to note for answering yes/no Operational Practices questions is that you should only leave the field unanswered if you do not know the answer to the question. If the answer is no, please select N. Unanswered questions are ignored by the pie charts and are not taken to mean 'no.'
Can I enter Operational Practices data for a building without entering energy usage data?
Yes. Please note that you still need to add a data year to indicate for which year your answers are valid. You may see a warning about low energy usage, but you should be able to save your data and use the Operational Practices Module with no trouble.
Can I still use the Operational Practices Module if I don't have any buildings in the tool?
Yes. In this case, you will see only one pie chart (the peer group chart). If you do own or manage buildings, we encourage you to enter your buildings' data via the Your Buildings tab. This will allow you to compare your practices more directly with those of your peers, and will also help us to build the anonymized peer group database for others to compare to.
Previous Versions and Improving the LBT
How can I suggest improvements to the LBT?
Contact lbt@i2sl.org with ideas or suggestions.
The database is hosted and maintained by LBNL. The LBT user interface is hosted and maintained by I2SL.
Are there any more planned upgrades for the
LBT?
We have released updates and features for the LBT every year since its launch in 2019, and we have many more planned as part of I2SL's Labs2Zero program. Stay tuned!
I'm interested in sponsoring enhancements to the LBT -- who should I contact?
Great! Please contact lbt@i2sl.org. We will be very happy to hear from you!
What happened to the old Labs21 Benchmarking Tool?
The Labs21 Benchmarking tool was retired from service in 2019 and the old web address now redirects here. The dataset behind the Labs21 tool was incorporated into the LBT database.
What happened to the data I entered into the old Labs21
Benchmarking Tool and how can I access my old account?
Your data and your user account were migrated from the old Labs21 database to the LBT database in 2019. You should be able to view all your data via the LBT now. Your username for logging into the LBT is the email address (not the username) you used for the Labs21 tool. To access your account, click on "Login" and use the "Forgot Password?" link to choose a new password for your account. You should then have access to any building data you entered in the old Labs21 tool.
What happened to the Actionable Insights Module?
The Actionable Insights Module was the precursor to the upcoming Labs2Zero Actionable Insights and Measures Report (the AIM Report). The Actionable Insights Module was retired in early 2024 in anticipation of the launch of the pilot AIM Report later in the year. Stay tuned!